|
ZiBaT => Peter
Levinsky => Big Data=> exercise |
Mandatory Assignment |
Updated : 2017-03-27
|
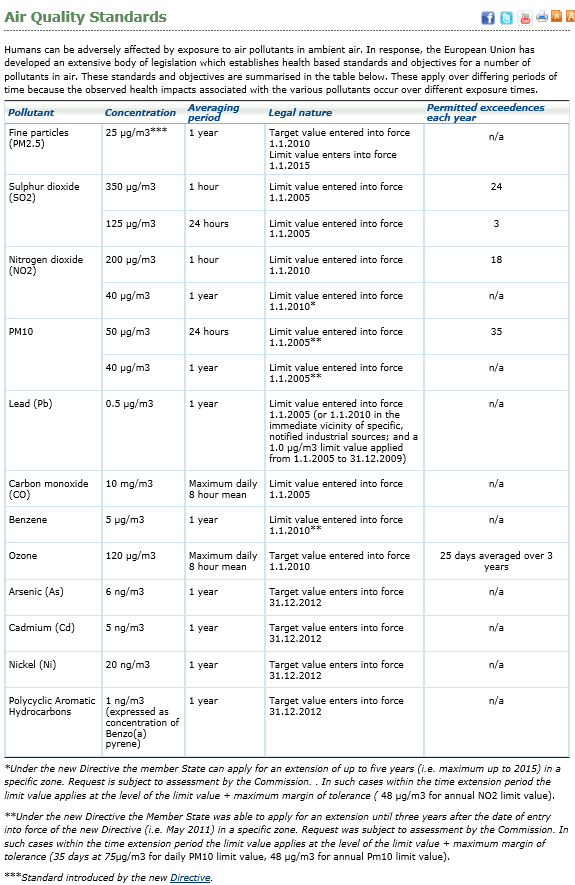
To analyse figures provided of Keld Mortensen (Environmental Science - ENVS).
The Domain is a data system for monitoring air quality based on measuring from Northern Greenland
You can work either individual or in a two person group.
Each individual / group must be announced e to the teacher before 29th March at lunchtime (see google document)
Each individual / group must also define the goal (What will you try) for your experiments - also to be announced the 29th March.
Work with the experiment in the period 22nd March to 26th April
Demonstration the result of your work in the class the 26th April between 12:30 PM and 3 PM.
In addition, you must hand in the material in Wiseflow.
The work will be parted in two
The data file you can get (see an overview of the data files Filedescriptions.pdf):
Hint: reading xml-files you can convert these into csv (see e.g. http://www.convertcsv.com/xml-to-csv.htm ) or use a mapper (see Streaming XML Files)
Find dependencies in data; You can try to find dependencies between one or more of these data:
You should set up a system where you upload the appropriated files to the HDFS, then use Spark or similar to make the analysing.
For more information of Spark:
To be provided ...